
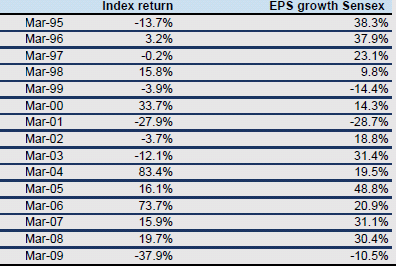
Most of us are inquisitive about the rationale behind our growth and P/E targets. We offer to explain the same taking historical EPS YoY growth of BSE Sensex from 1995 to 2008.
On the basis of valuation, growth targets are modest if you look at them from a historical perspective.

In the table above, data suggests that EPS usually grows 15%-20% in the year following a declining profit year in the market. However, EPS growth would be higher if the survivorship bias in the index was adjusted.
Will history repeat itself? We think so - particularly if the country has better governance and global factors are not disabling.
For our market P/E target, we are assuming a relatively modest expansion of P/Es from the current 15.5x one-year forward to 17-19x one- year forward as investors’ increase their appetite for risk. This is the normal trend 12 months from the bottom of every past cycle.
Clear picture will emerge not just after the Budget presentation but after Q1-FY10 management guidance. Long Term, stay bullish and take the opportunity to invest on every dip.
On the basis of valuation, growth targets are modest if you look at them from a historical perspective.
In the table above, data suggests that EPS usually grows 15%-20% in the year following a declining profit year in the market. However, EPS growth would be higher if the survivorship bias in the index was adjusted.
Will history repeat itself? We think so - particularly if the country has better governance and global factors are not disabling.
For our market P/E target, we are assuming a relatively modest expansion of P/Es from the current 15.5x one-year forward to 17-19x one- year forward as investors’ increase their appetite for risk. This is the normal trend 12 months from the bottom of every past cycle.
Clear picture will emerge not just after the Budget presentation but after Q1-FY10 management guidance. Long Term, stay bullish and take the opportunity to invest on every dip.
