Showing posts with label overvalued stocks. Show all posts

Thursday, May 20, 2010

Stocks heavily oversold/overbought trend reversal expected on basis of April'2010

Stocks heavily oversold/overbought and trend reversal expected anytime on basis of ADX NSE 24.04.2010
A high value of ADX indicates that Trend is into overbought/oversold region
Trend reversal can take place any time.
Wait for trend to reverse
and then buy stock or sell stock according to situation

NSE Code close volume adx
VALECHAENG 204.65 268413 66.97
MAGMA 303.8 155571 63.76
SIL 48.3 26633 62.87
VAKRANSOFT 166.7 92809 60.28
UNITY 118.75 34524 58.98
HITACHIHOM 275.25 37269 58.91
KOTAKPSUBK 360 668 58.73
SURANAT&P 46.95 60606 58.58
BLUEDART 911 17213 58.46
VINDHYATEL 198.1 202 57.86
PANASONIC 182.75 24640 57.12
ICRA 991.15 3893 56.73
DICIND 277.05 38288 56.51
EXCELINDUS 72.5 6251 55.91
BAJAUTOFIN 406.25 20281 55.84
NATCOPHARM 178.25 552795 55.69
COX&KINGS 514 166955 55.36
HCIL 549.4 12278 55.15
ERAINFRA 233.85 157926 55.1

Saturday, October 24, 2009

Is the Indian market overvalued?

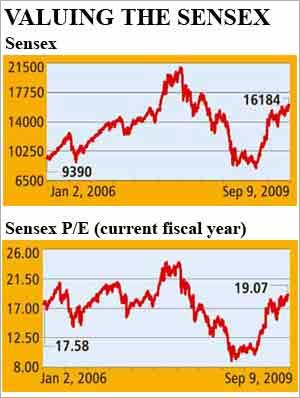
Look at the price-earnings ratio, and not just the Sensex, writes Shobhana Subramanian.

A look at the Sensex value doesn't give you the correct picture since what matters is the earnings outlook for companies. It would be incorrect to assume that the markets are cheaper when the Sensex is at 15,000 or that they are more expensive when it is at 20,000.

That's because a market is valued according to the estimated future growth in profits of companies. The growth outlook for companies can be brighter when the market is at 20,000 and so the market can actually be cheaper at those levels.

Conversely, if the prospects for growth are muted going ahead, the market could be expensive even at 15,000.

So one useful metric with which to value the market is the price-earnings (P/E) ratio.

If you were bottom trawling, however, you could consider other metrics like the dividend yield. If the dividend yield is say 4-5 per cent, then it is worth buying these stocks because one is getting an assured return and over two years one can expect some capital appreciation.

What is the price-earnings (P/E) ratio?

If company A's share costs Rs 100 and it is expected to give shareholders an Earning Per Share (EPS) of Rs 10 in the current year ending March 2010, the current P/E is 10. If the EPS for the year ending March 2011 is expected to be say Rs 15, the forward P/E is 6.6.

The P/E for the market is typically the P/E for the benchmark index. One of the simple ways to arrive at the EPS for the 30-company Sensex: The EPS of each of the constituents is multiplied by its respective free-float market capitalisation.

Then these numbers are added and the total is divided by the sum of the individual free-float market capitalisations.

That gives weighted EPS of the Sensex. To arrive at the Sensex P/E, the Sensex is divided by the Sensex EPS. Consensus estimates (typically the average of estimates from about 20 brokerages) for the Sensex are Rs 900 for 2009-10.

Since the Sensex is at 17,100 right now, this means the current P/E is 19. For the year 2010-11, the consensus, right now is Rs 1,050, so the forward Sensex P/E is 16.2.

So, how does one judge whether the Sensex P/E is high or low?

The P/E ratio has to be benchmarked to the historical P/E of the country and also to the P/Es of peer group markets. India's historical long-term average P/E is close to 15. So, from a historical point, the Sensex is more expensive currently. India's peer group would include countries such as Taiwan, Korea, China, Brazil [ Images ], Russia [ Images ] and other emerging markets.

As of now, Taiwan is among the most expensive markets in the region, trading at a current P/E of over 30 times mainly because the market expects a huge spurt in earnings of over 75 per cent in calendar 2010, following the recovery in the US economy.

Korea is slightly cheaper - at around 14.5 times - than India, although the earnings outlook is slightly better than that for India. China is cheaper than India, justifiably because the earnings outlook for that market is less exciting than that for India.

What is the relation between P/E and interest rates?

Typically, there is an inverse relationship between interest rates and P/Es. P/Es are a function of risk appetite, the higher the risk appetite the higher the P/E. In a tight money scenario, when interest rates are high, people are risk averse so the P/E will be low.

In an easy money environment, when interest rates are low, people are willing to borrow to invest in the markets and so the prices move up, pushing up the P/E. Currently in India, interest rates are trending down in an easy money environment.

Shobhana Subramanian in Mumbai

Friday, May 22, 2009

How to identify undervalued stocks or overvalued stocks

As for "the criteria/methodology" for undervalued stock, the general rule is to discern the intrinsic value of the
Company and compare it to its enterprise value. For enterprise value, it's the sum of the market value of equity plus
the market value of the debt less surplus cash. You want to buy the stock when it's current market value is trading
at a deep discount to the intrinsic value. As for intrinsic value, you might need to perform a discount cash flow (DCF)
Analysis, a replacement value analysis (how much money it would take creates the current company today), etc.

As for the "things we need to look at to evaluate," you need to understand how the firm makes money, how it generates free cash flow, what it's return on invested capital is, etc. In order to understand the firm, you need to understand the industry, how the company fits in within the industry, where is the industry and company going in the future, etc.

To simplify the task of identifying undervalued stocks, there are several simplified criteria that can be used and are
readily available on the internet. These are PE ratio, PEG ratio, ROE, PS ratio, DE ratio, dividend, and historic data. Generally speaking stocks with lower PE ratios (price divided by earnings ratio) are more likely to be undervalued than those with higher PE ratios. The cut off is somewhere in the range to 12 to 16. That does not mean that a stock with a PE ratio of 20 is necessarily overvalued but it does mean that it might be. Also a stock with a PE ratio of 10 may not be undervalued. That is where the PEG ratio comes into play. This is the PE ratio divided by the expected growth rate. A PEG ratio of less than 1.00 is considered likely undervalued. A PEG ratio of more than 2.00 is most like overvalued. The problem with the PEG ratio is ascertaining the projected growth rate. You can find published PEG ratios on the internet for many companies, but unfortunately the projected growth rates upon which they are figured are normally concocted by overly optimistic security analysts, so taking them with a pound of salt is called for. DE ratio (debt to equity ratio) is also a helpful indicator.

The higher this ratio the more leveraged the company is and the higher the interest payments are. A high DE ratio many
times is correlated with a low PE ratio because the quality of the earnings is less and the ability of the company to
weather a downturn is less. The airlines were good examples of this. They were all highly leveraged and they all went
bankrupt as a result when they could not meet their interest payments.

ROE (return on equity) is an indicator of how profitable the company is. More profitable companies are generally valued more highly than less profitable companies. Historical comparisons can also be a significant indicator of the value of a company. All other things being equal if the company in the past sold at a PE ratio of 17 and it is now selling at a PE ratio of 13, it might be undervalued. It also might be the result of lower future expectations for the company such as we are seeing in the market today.

Please keep in mind that stocks can remain undervalued and overvalued for long periods of time, so invest wisely.